You can track and analyze key indicators of your experiences to gain insights, follow trends and improve your performance over time.
To get to this page, you need to select the Analytics part in the menu, then the Experience tab.
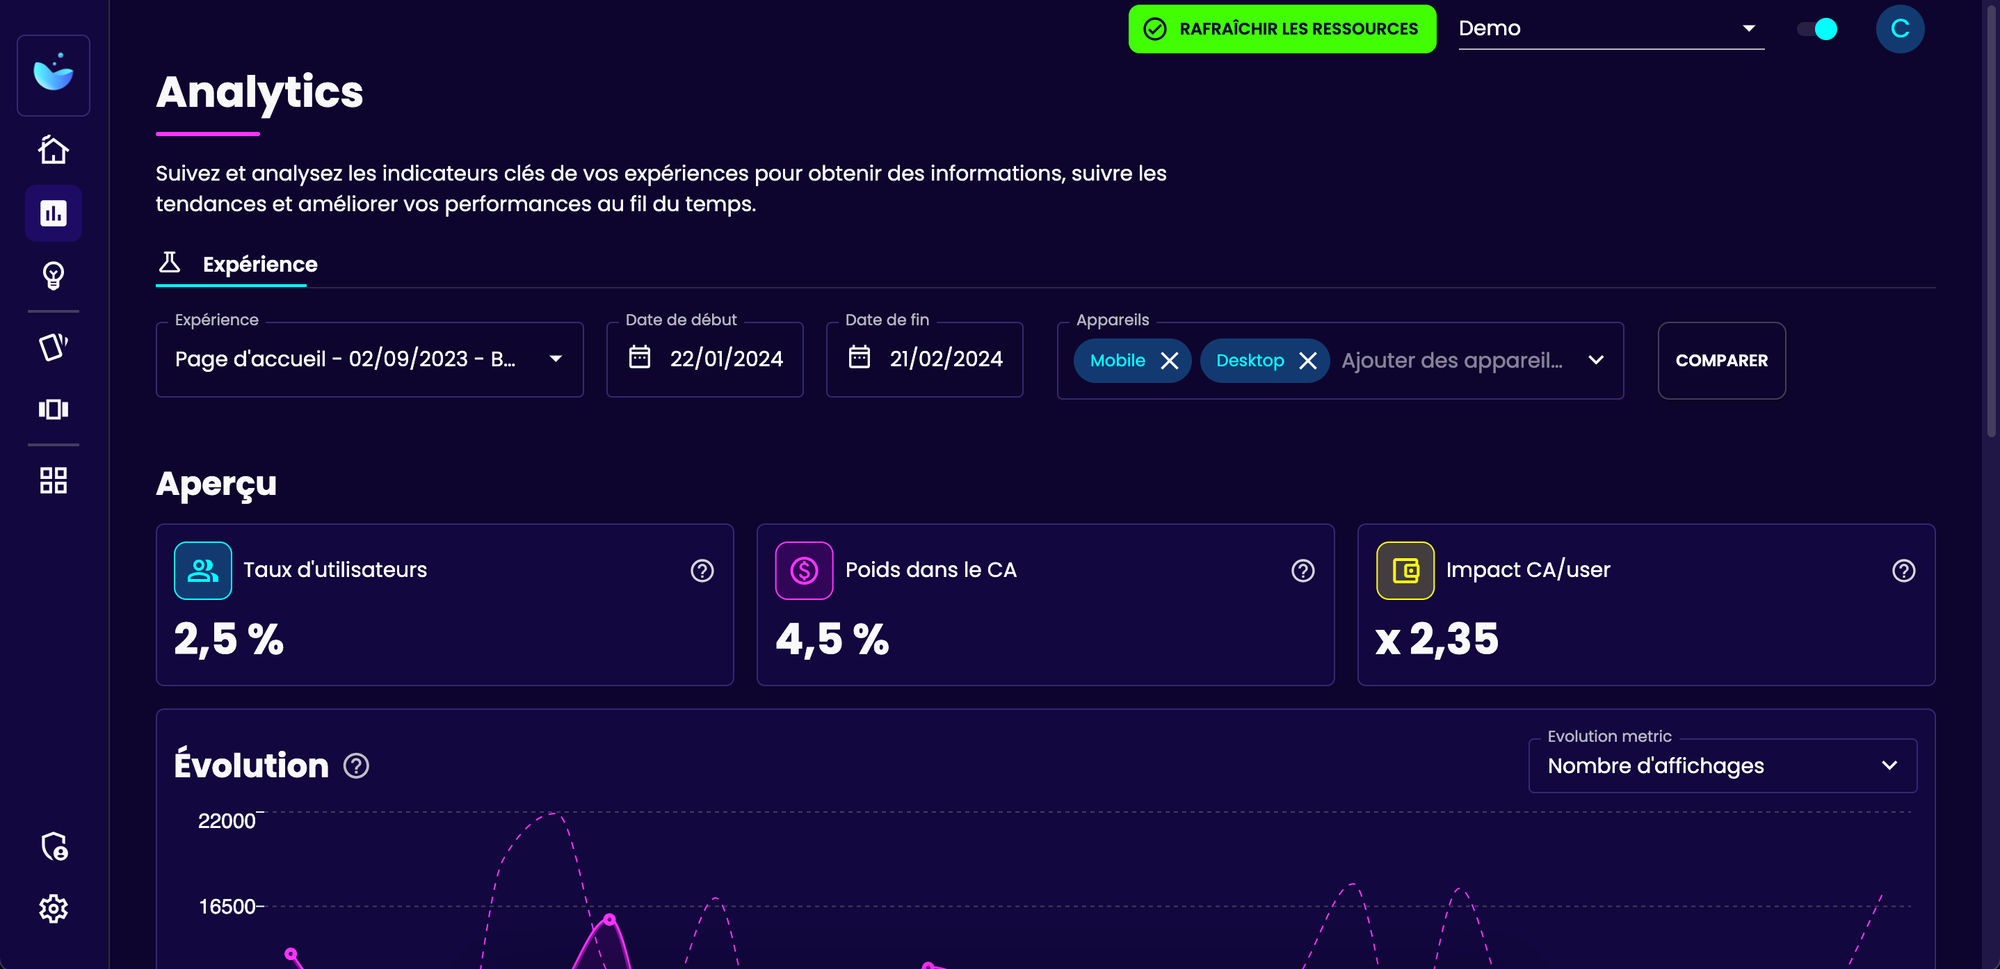
Filters
You can therefore set up filters to see the indicators that interest you:
- Selection of an experience used on the site
- The period over which you want to analyze the data
- The types of materials used: Phone or Computer

Indicators
Here are the indicators on the selected experience that you will be able to analyze:
- The percentage of visitors exposed to the experience and who used it
- The percentage of the site's revenue generated by this experience
- The ratio between the revenue per visitor of users who used the experience and those who did not use it

Graph
You then have the opportunity to analyze the data over the selected period thanks to a graph that compares with the previous period:
- The number of displays
- The number of uses
- The number of closures
- The usage rate
- The closure rate
To choose this type of data, you have a dropdown list at the top right of this chart.
If you hover your mouse over the graph, you will get more information on the selected date such as:
- The actual number
- The compared dates
- The percentage difference between the two periods
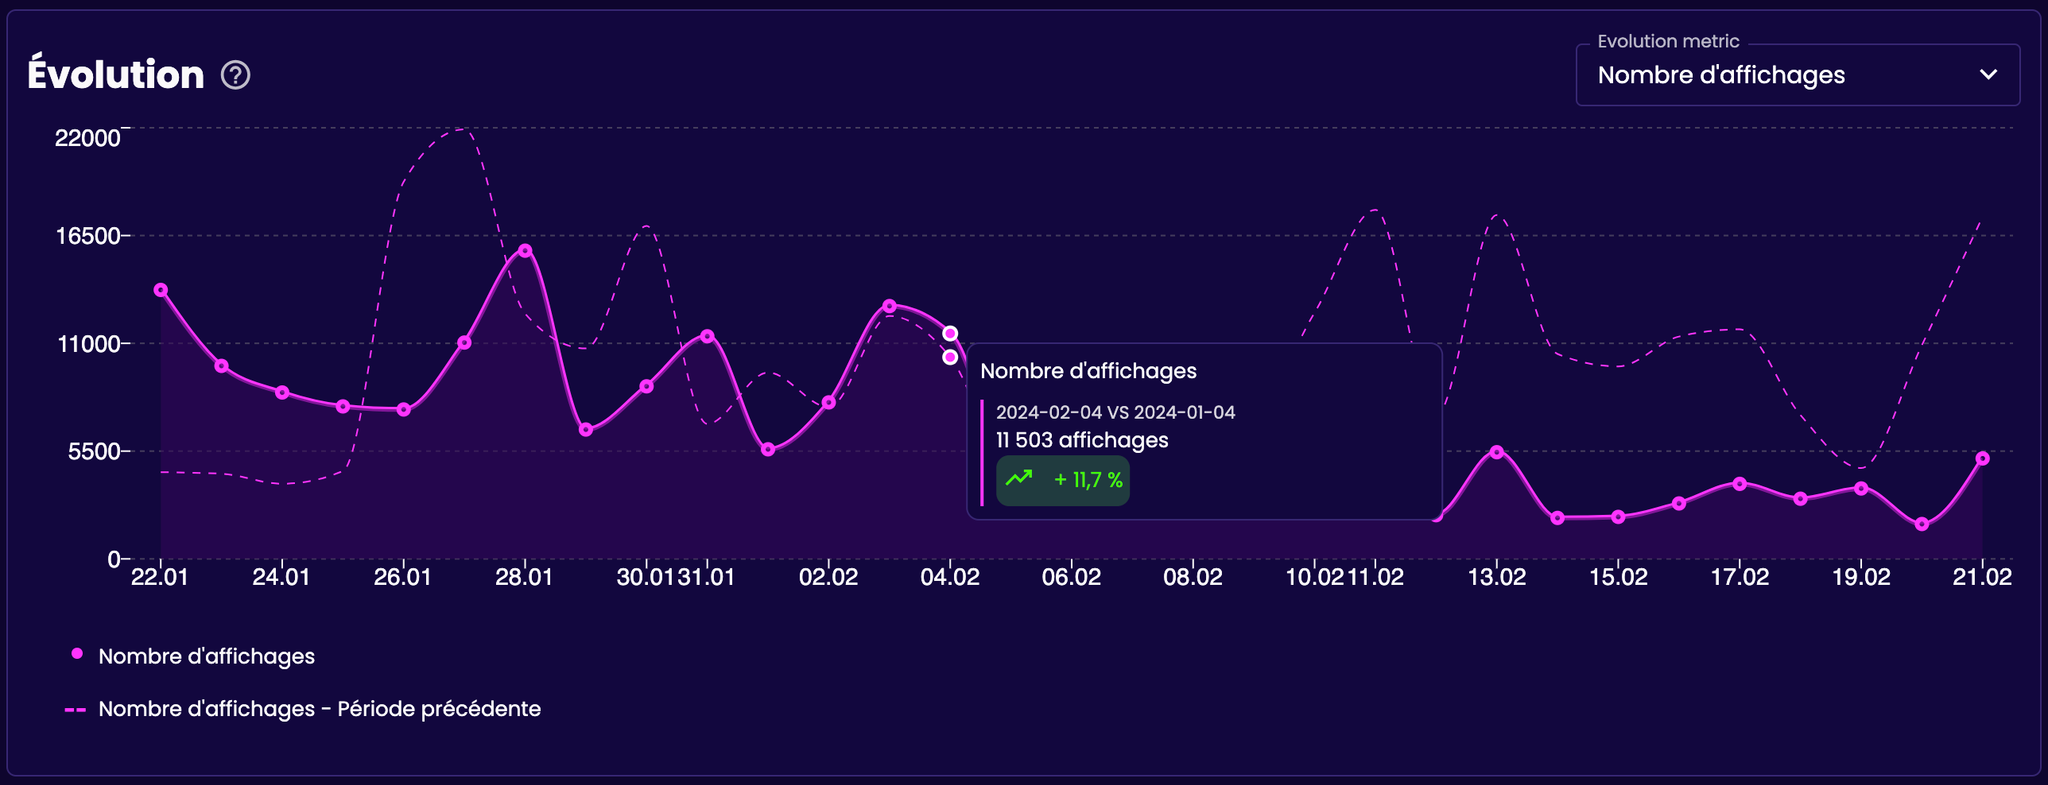
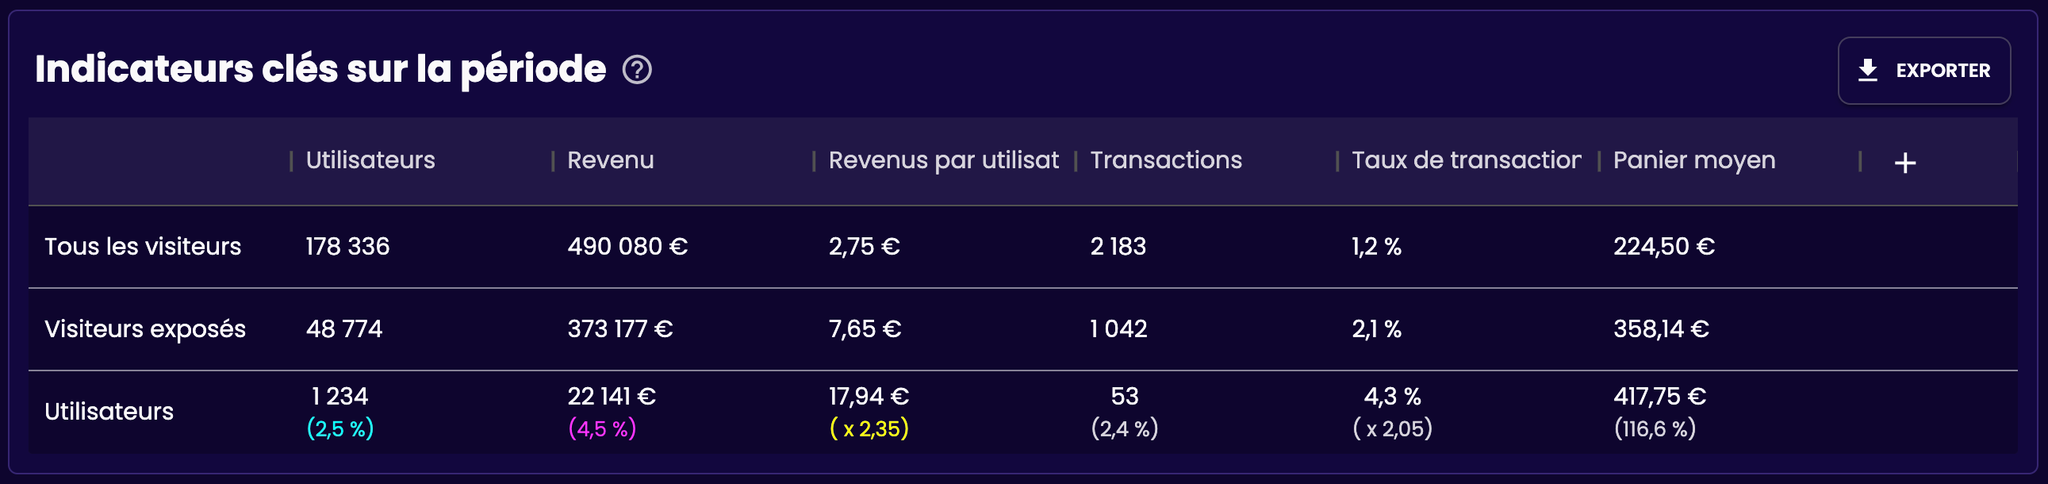
Table of key indicators
Next, a table will list the key indicators for the selected period concerning:
- All site visitors
- Visitors exposed to the experience
- Visitors who used the experience
Here are the indicators you can see:
- The number of visitors
- The revenue generated by visitors
- The revenue per visitor
- The number of transactions
- The transaction rate
- The average basket amount
You can choose which indicators to display or not using the "+" button located in the last column. Only the selected columns will be displayed in the export.
You can export this data using the button located at the top right of the section.
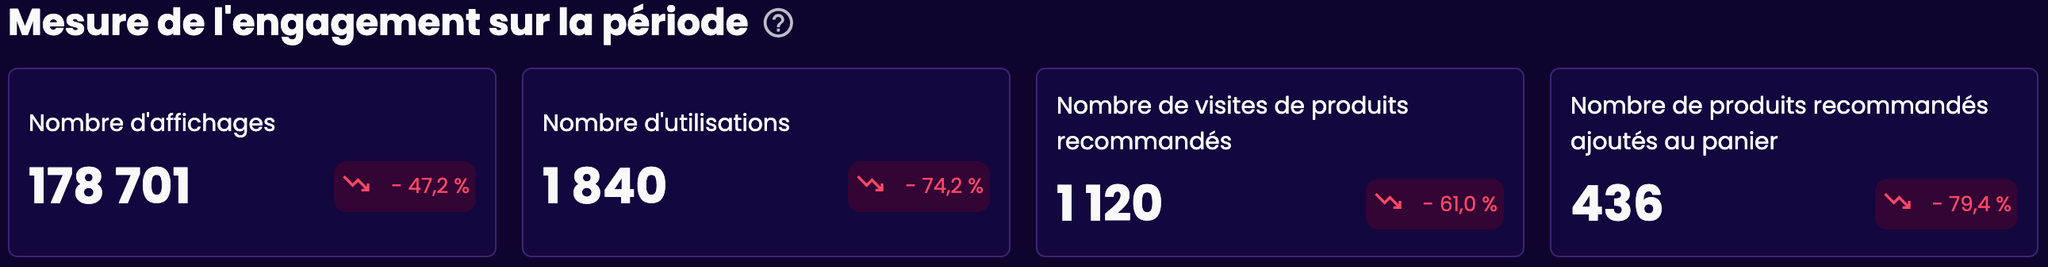
Measurement of engagement over the period
Finally, some additional indicators for the selected period will be displayed with a comparison to the previous period:
- The number of displays
- The number of uses
- The number of visits to recommended products
- The number of recommended products added to the basket